Join our community of 2000+ keen hunters for free and receive our best tips
No Spam! Just Pure Hunting Goodness in your Inbox 🏹
🏅 According to the National Survey of Fishing, Hunting & Wildlife-Associated Recreation in 2016, the total spend on hunting in the U.S. was $26.2 billion.
According to the National Survey of Fishing, Hunting & Wildlife-Associated Recreation in 2016, the total spend in the United States on hunting was $26.2 billion.
The survey – the largest of its kind – is done every five years to collect information on anglers, hunters and wildlife watchers across the United States.
The latest survey shows a decline in spending on hunting, having come down from $33.7 billion in 2011. However, it does remain higher than the findings of the previous 2006 edition, noting expenditure of $22.9 billion.
To collect the data, they interview U.S. Residents to get an idea of the changing landscape of outdoor recreation, and its future economic impact.
The statistics include hunters – with or without a licence – who hunted big game, small game, migratory birds, or other animals.
Hunting weapons include rifles, shotguns, pistols, handguns, archery equipment, crossbows and muzzleloaders.
$26.2 billion was spent on hunting in 2016.
$26.2 billion was spent on hunting in 2016.

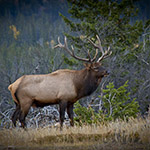
Spending on big-game related hunting trips and equipment reached $14.9 billion in 2016.

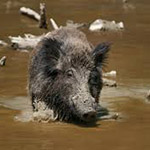
Around 3.5 million hunters went small-game hunting in 2016, for a combined 38 million days.

Impressively though, they managed to spend more than small-game hunters, investing some $2.3 billion on their hobby in 2016.
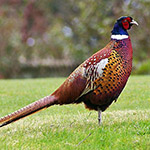
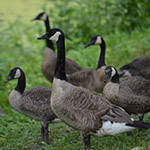
Migratory birds include waterfowl, doves, ducks and geese amongst others.

9.2 million hunters spent $14.9 billion hunting big game in 2016.
9.2 million hunters spent $14.9 billion hunting big game in 2016.
No Spam! Just Pure Hunting Goodness in your Inbox 🏹
Going hunting can get quite expensive due to all of the additional costs related to a hunting trip.
Speaking broadly, we spend our money on three categories.
In 2016 we spent a total of $9.2 billion on trips and their related costs.

Lodgings rental, food, drink.

Vehicles, gas, tickets, etc.

Guide fees, land use fees, equipment rental, etc.
In 2016 we spent a total of $12.8 billion on hunting equipment.

Guns, rifles, bows, arrows, crossbows, broadheads muzzleloaders, telescopic sights, ammunition, etc.

Camping equipment, binoculars, hunting attire, best climber stands, best lock-on stands, light hang ons or light climbing tree stands, safety harnesses, etc.

Campers, all-terrain vehicles, etc.
In 2016 we spent a total of $2.9 billion on additional costs, such as memberships, subscriptions, land leasing, permits and plantings.
Although they don’t seem like much, these additional costs start to add up significantly.
Importantly, many of these costs go towards the conservation of land and hunted species, bolstering their numbers and protecting them for the future.


To entice game.
The US population in 2016 consisted of 323.4 million people. There are 11.5 million hunters, which is roughly 3.5% of the total population.
Hunting is undoubtedly a male-dominated pastime. Of nearly 12 million hunters, men make up almost 90%.
Hunting is predominated by an ageing population.
When compared against surveys from 2011 and 2006, hunting not only has slightly fewer followers than 5 or 10 years earlier but is also losing interest in younger generations.
The participation rate in hunting increases as household income increases.
When compared to previous surveys, it seems that either inflation is taking its toll on lower-income hunters.
Hunting contributes significantly to the U.S. economy, contributing $26.2 billion in 2016.
The majority of this was spent on hunting trips and equipment purchase for hunting big game.
Total expenditure has dropped significantly by 22% from 2011, which seems to be from a declining interest from younger generations in hunting.
Your 101 Guide to the best crossbow, ground blind, and tree stand reviews.
Important Disclaimer: I am a participant in the Amazon Services LLC Associates Program, an affiliate advertising program designed to provide a means for me to earn fees by linking to Amazon.com and affiliated sites. As an Amazon Associate I earn from qualifying purchases.